April 28, 2020

These maps and apps tell you which businesses are open in your NYC neighborhood

We all want to support the small businesses in our New York neighborhoods during this difficult time. But sometimes it's hard to keep track of which stores and restaurants are currently open. A number of local websites and organizations have created easy-to-use search engines and interactive maps that provide information on open businesses.
Explore the maps
April 23, 2020

Most NYC sidewalks are too narrow for proper social distancing

In a dense city like New York, social distancing is no easy task. Garbage piles, sidewalk sheds, and people make it hard to maintain six feet from others, the recommended distance to prevent the spread of the coronavirus. A new interactive map created by urban planner Meli Harvey shows the width of each sidewalk in the city, with the most narrow highlighted in red and the widest in blue. As expected, there's a lot of red on the map.
Explore the map here
April 17, 2020

55 years and 37,000 designations later, Landmarks releases anniversary story map

Just a few years after the demolition of the original Penn Station, the city founded the Landmarks Preservation Commission, in part, to make sure beautiful historic buildings were never destroyed again. When Mayor Robert Wagner signed the Landmarks Law on April 19, 1965, the commission was officially tasked with protecting sites that represent New York's history and culture. During its 55 years in existence, the LPC has designated more than 37,000 buildings and sites. In honor of this anniversary, the commission this week released an interactive story map highlighting its work over the last five decades, from its first individual landmark, the Claesen Wyckoff House, to its first LGBT designation, the Stonewall Inn.
Explore the map
April 3, 2020

Find out which NYC construction sites are ‘essential’

Last week, Gov. Andrew Cuomo temporarily banned all non-essential construction statewide, as part of his "pause" executive order. The updated order allows only emergency construction, or work "necessary to protect the health and safety of the occupants" to occur during the coronavirus pandemic. To track projects that are considered essential in New York City during this time, the city's Department of Buildings on Friday launched an interactive map that identifies sites where work can continue.
Explore the map
March 23, 2020

Brooklyn kids are hanging rainbow art in windows as part of a quarantine-style scavenger hunt

With school closed and playdates off-limits, New York City kids are staying connected with their friends in a creative and colorful way. Children in Brooklyn are drawing and painting pictures of rainbows and displaying them outside of their homes, creating a scavenger hunt perfect for one of the only quarantine-approved activities: a walk around the neighborhood.
Get the details
December 13, 2019

Find landmarks of the anti-slavery movement in NYC

For roughly 200 years, between 1626 and 1827, New York City was home to more enslaved Africans than almost every other city in the country. But after abolishing slavery nearly 40 years before the nation, the city became a major player of the national abolitionist movement, housing anti-slavery activists and organizations, as well as many stops on the Underground Railroad. Now 400 years after the first enslaved Africans arrived in the United States, the Landmarks Preservation Commission released this week an interactive story map highlighting designated city landmarks tied to the abolitionist movement.
Explore the map
December 4, 2019

New map shows over 600 languages spoken in NYC

More than 600 languages are spoken in the New York metropolitan area, making it one of the most linguistically diverse regions in the world. The Endangered Language Alliance (ELA), a non-profit that aims to protect endangered languages across the city and New Jersey, released this week a comprehensive map of the area's 637 languages and dialects at nearly 1,000 sites. As first reported by Gothamist, the map coincides with the 2019 International Year of Indigenous Languages, declared by the United Nations in 2016, as well as the upcoming 2020 census.
Explore the map
November 25, 2019

MAP: The best spots to watch the Macy’s Thanksgiving Day Parade

It's almost time for the Macy's Thanksgiving Day Parade, and with 2.5 miles of public viewing areas along the route this year, anyone eager to claim a good spot should be able to with a little planning. This interactive map put together by the parade organizers outlines the stretches that have the best views as well as all the areas that will be restricted to the public. The map also notes where you can find essentials like restrooms, coffee, and food.
READ MORE
October 17, 2019

DOB releases new, interactive map tracking after-hours construction permits throughout the city

The City’s Department of Buildings has just released a new, interactive map that shows the location of all building construction projects that have been granted permits to proceed with work outside of normal business hours. These types of permits, known as an after-hours variance (AHV), apply to work taking place before 7 a.m., after 6 p.m., or anytime during the weekend. The DOB issued 18,866 AHV permits in 2018 and received 3,729 public complaints through the 311 system regarding construction work illegally performed after hours. The map will be updated daily and include links to further information about each project so that tenants have a way of confirming the status of construction projects on their block.
More information
September 30, 2019

Report suggests looking to zoning to speed up subway accessibility; map shows which lines lag

Despite recent progress–and a federal lawsuit–only 23 percent of New York City's 493 subway and Staten Island Railway (SIR) stations are fully ADA-accessible, a statistic which puts the city dead last among the country’s 10 largest metro systems for accessibility of its transit stations. The MTA has made a commitment to funding accessibility in its much-discussed Capital Plan, but hundreds of stations are still without without plans for ADA access. On Friday Speaker Corey Johnson and the City Council released a report showing that the use of zoning tools to incentivize or require private development projects to address subway station access could speed up progress toward the goal of system-wide ADA access–and simultaneously cut public expense. The report, and an interactive map, show the current system, future plans and what the use of zoning tools could accomplish.
Find out more
September 23, 2019

New City of Women map assigns a significant female figure to all 424 subway stations

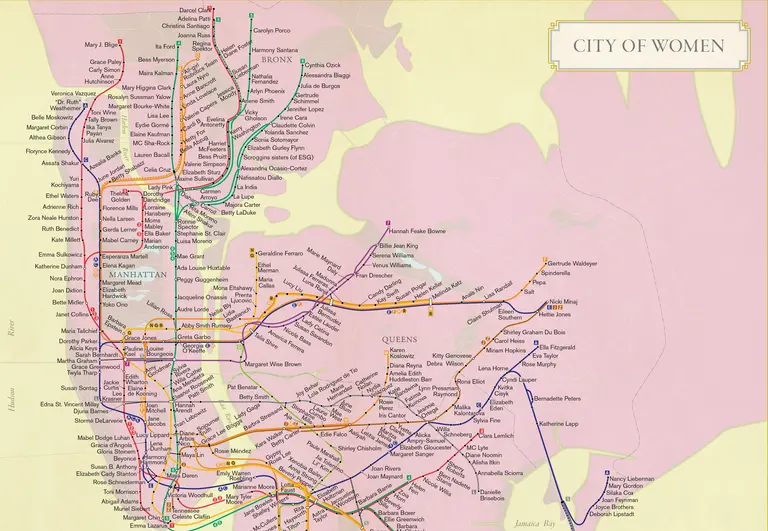
Three years ago, journalist Rebecca Solnit and geographer/writer Joshua Jelly-Schapiro created City of Women, a subway map that replaces stations with significant women in NYC's history and cultural landscape. The map was originally part of their book “Nonstop Metropolis: A New York City Atlas,” but they've now done an updated version that's currently for sale at the New York Transit Museum. In this revamp, they've assigned a woman to all 424 subway stations and have added 80 names, including Cardi B and Alexandria Ocasio-Cortez. Ahead, we chat with Joshua to learn more about the inspiration behind the map, how they chose the names, and what's next.
READ MORE
September 20, 2019

Urban Archive’s new History Crush feature lets you swipe right on your favorite images of NYC’s past

6sqft previously featured Urban Archive, the technology nonprofit that has been building (no pun intended) connections 
between people, places, and historical institutions through a growing map of New York City’s unique architecture, culture, and stories for several years. Last February saw the launch of their citywide project seeking crowd-sourced histories and photographs to be included in the UA app. Now, the Urban Archive app has a fun new feature: History Crush serves users a steady randomized supply of historic images of NYC buildings, places and events. You can weigh in with a swipe left or right on each new image; yes, it's like the dating app (without the stress). This Adderall-era add-on actually makes the app even more addictive–and encourages users to check out more images. Even better, right-swiped and liked images are saved to a folder in your My Archive collection for future investigation.
Every picture tells a story
June 25, 2019

MAP: Where to watch the 2019 4th of July fireworks

The talented folks behind the hotly anticipated Macy’s Fourth of July live fireworks spectacular happening next Thursday evening have provided a detailed guide to the prime Manhattan spots for watching the night sky light up. Read on to get the scoop on official viewing points–and some unofficial favorites–and use the interactive map to make sure you’re in the right place when the pyrotechnics start at the Brooklyn Bridge.
More top viewing spots
May 20, 2019

Mapping the lesbian bars and clubs of NYC’s past

Following the closure of Woodside's Bum Bum Bar in March, only three lesbian bars remain in New York City. To preserve the history of these significate sites, local artist Gwen Shockey has spent five years tracking locations of former lesbian and queer clubs (h/t Daily News). Through an interactive map, Shockey has mapped more than two hundred addresses of venues that once hosted events for lesbians, relying mostly on word-of-mouth storytelling.
See the map
May 13, 2019

Watch New York City grow from 1609 to today with this animated video assembled from historic maps

When it comes to the development of New York City over many, many years, we tend not to see the forest for the trees, so to speak. Here Grows New York, an animated map created by urban development buff Myles Zhang, gives us a seriously forest-eye view of how the city changes from the time the first native American tribes populated the five boroughs in 1609 to the noisy tangle of highways of 2019. Complete with cool facts and a soundtrack, the map visually animates the development of this city’s infrastructure and street grid using geo-referenced road network data, historic maps, and geological surveys, highlighting the kind of organic growth spurts that drive development over time, providing an "abstract representation of urbanism."
Watch the city grow before your eyes
April 29, 2019

New ‘Then and Now’ map shows over 2,200 historic buildings in Greenwich Village

To celebrate the 50th anniversary of the landmark designation of the Greenwich Village Historic District on April 29, 1969, Village Preservation has released an online map and tour of the district. The online tour shows each and every one of the over 2,200 buildings in the district as they looked in 1969 and today.
Find buildings on the interactive historic district map and more
April 26, 2019

New interactive tool tracks transit ridership in America’s cities

The story of public transit in America is an ongoing one: We need more of it, in more neighborhoods; we need to pay for it; ridership is declining in some places and growing in others. The state of transit often varies wildly depending on the city it serves. Transit Insights, a new visual tool from TransitCenter allows you to compare the country's transit systems in recent years while looking into factors like regional population changes and density, fare prices, operating costs and how many miles the system covers. Transit Insights combines information from the National Transit Database, the U.S. Census and route maps from Transit.Land into a visual format so you can reference information quickly and easily.
What's the story behind your city's transit system?
March 25, 2019

See how NYC’s urban density stacks up against other major cities

As part of their larger report "Developing Urban Futures," the Cities Urban Age Program at the London School of Economics created a new series of digital density diagrams, 3D models that visually demonstrate the density of people in cities around the world. The maps combine a range of socio-economic data, including where people live, work, and commute to capture the key spatial dimensions of urban economic life. The taller spikes represent larger concentrations of people, while the flatter zones represent lower density concentrations, for example, residential or suburban neighborhoods.
READ MORE
Pitch a story icon Know of something cool happening in New York? Let us know:
March 20, 2019

Find your favorite spring blooms in Central Park with a map and interactive guide

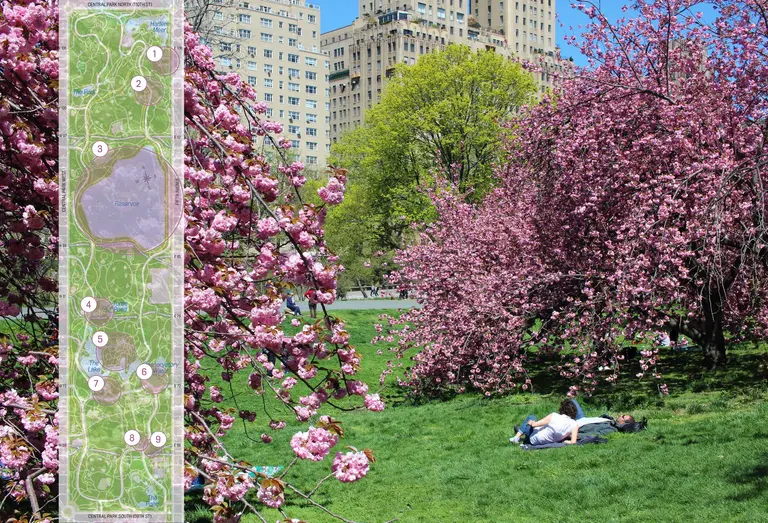
Spring is officially here, and there's no better place to confirm the good news than Central Park, where the season brings a burst of color to every corner of the park's 840 acres. Warmer weather brings beautiful blooms and a flurry of activities and events along with photogenic landscapes. The park's Spring Guide has all you need to know about the park's prettiest places to visit; a handy map points out where the blooms are, and you can search for your favorites and learn more about them. There are also events for families, Conservancy members and the general public that will help you make the best of the season's beauty.
Where the blooms are, this way
March 1, 2019

Grubhub maps all of the restaurants in NYC run by women

Coinciding with the first day of Women's History Month, Grubhub announced on Friday that it is partnering with the James Beard Foundation to support initiatives that help advance women in the culinary field. Through the end of March, diners who order food on Grubhub can donate their change to the foundation's Women's Leadership Programs. And the delivery service company has added thousands of women-led restaurants to its nation-wide RestaurantHER map, which launched last year as the first of its kind.
More this way
February 5, 2019

City sees an unprecedented 37 percent drop in evictions

The mayor's office announced this week that New York City's residential evictions by marshals had declined by 37 percent since 2013, with approximately 18,000 evictions in 2018 compared to almost 29,000 evictions in 2013. In Manhattan, evictions are down 47 percent since 2013. What that means: Since 2013, more than 100,000 New Yorkers who might otherwise have faced evictions have been able to stay in their homes. And evictions decreased 14 percent in 2018 alone. Maps from the New York City Council show data on where the most evictions happen and allow you to search for a specific address in any borough to find out more.
Universal Access to legal aid, maps and more
January 31, 2019

TransitCenter maps out the next 50 subway stations that should be made accessible in NYC

Photo via Flickr cc Roughly 75 percent of New York City's 472 subway stations are not accessible--a fact that has long plagued disability advocates but has now taken on a more pressing call to action after 22-year-old Malaysia Goodson died after falling down the stairs carrying her baby in a stroller at one of these stations. To visualize this dire need, TransitCenter has put together a map that proposes the next 50 subway stations that should be made accessible under the MTA’s Fast Forward plan. If implemented, their plan would "more than triple the potential station-to-station trips riders who rely on elevators can make using accessible stations."
How did they choose these 50 stations?
December 21, 2018

Chimneys and reindeer food: These maps optimize Santa’s Christmas Eve efficiency

Santa may not have an engineering background, but he certainly knows his location intelligence, considering he's long been able to deliver billions of gifts around the world in just one night. But with population growing and delivery becoming faster and faster (ahem, Amazon), the team at Datastory decided to help him out and optimize his Christmas Eve travel. Using the metrics of population, fly times, fireplaces, cookies, milk, and reindeer food (aka grassy areas), they've suggested "distribution points that maximize access to everyone on the nice list," so that, in theory, "his elves could stage the gifts in just the right places, helping Santa complete the job in time."
Learn more about Santa's travels

Our Mission

More than just current events, here you'll learn about the places, people, and ideas that are shaping your city.