December 19, 2018

What are the chances of a White Christmas in NYC this year?

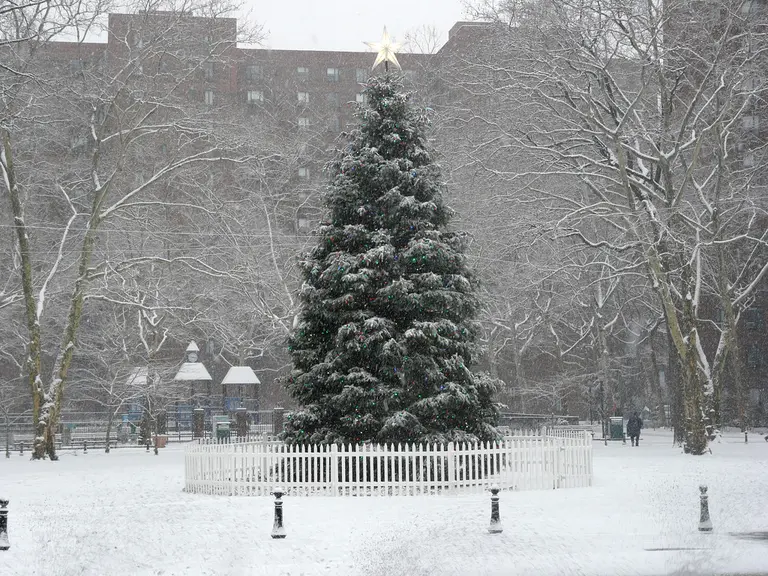
The chance of getting a White Christmas in New York City this year is sadly unlikely, but not impossible. The team behind the Omni Calculator Project created an online tool that provides the probability of snowfall in major cities across the United States as well as the closest White Christmas--meaning at least one inch of snowfall on Dec. 25--near that city. While the White Christmas Calculator says NYC has a roughly 12 percent chance of seeing snow next Tuesday, there are four nearby cities with a nearly 50 percent chance of enjoying some flurries.
Dreaming of a White Christmas?
December 19, 2018

This subway-style map plots NYC parks

Need a gift for the New Yorker who has it all? How about this fun map from the Parks Department that plots NYC parks in the style of a traditional subway map? Not only can you peruse the map online, but just for the holiday season, limited-edition, full-size posters of "Next Stop: NYC Parks" are available for purchase.
READ MORE
December 12, 2018

This tool maps thousands of plaques around the world, including hundreds near NYC

While most New Yorkers know the city has been full of historical events and figures since its founding, it's sometimes hard to remember where all these significant milestones took place. An interactive map called "Read the Plaque" features 17,000 plaques found across the world, with over 100 in New York City alone. As part of the radio project 99% Invisible, Read the Plaque imports plaques from around the world, with each featuring locations, descriptions, and pictures.
Explore NYC's plaques
December 6, 2018

Central Park releases access map for people with limited mobility

A new map from the Central Park Conservancy includes lots of new information about the park's playgrounds, trails, restrooms, entertainment areas and other spaces that decodes the park for people with disabilities and/or limited mobility. Helpful information includes information on park terrain, letting visitors know how steep various trails are, and where there are stairs or other potential obstacles.
Full map, this way
November 21, 2018

MAP: Where to watch the Macy’s Thanksgiving Day Parade

There are 2.5 miles of public viewing along the parade route in NYC; this interactive map can help you find a great spot instead of getting lost in the crowd. The map, from the fine folks behind the parade, outlines when the parade will pass by, which streets have the best public views (6th Avenue from West 59th to West 38th Streets gets the thumbs-up) and which ones are restricted, such as Central Park South at Columbus Circle. Also marked are all-important things like coffee, food, and restrooms.
More info, this way
November 12, 2018

This map shows the diversity of NYC’s veterans in every neighborhood

The New York City greater metropolitan area is home to over a million service members, veterans and their families. To provide an idea of just how many veterans call the city home–and how diverse a community they are– the New York City Department of Veterans' Services has compiled a set of maps using the most recently available data from the American Community Survey and the US Department of Veterans Affairs.
Maps and more info, this way
November 2, 2018

You can buy the earliest ‘portable’ NYC subway map for $12,000

New Yorkers have used maps to navigate the city's subway system since the first year the system opened 114 years ago. And one of only two known examples of the Interborough Rapid Transit's first guide is for sale for $12,000, the New York Times reported. That 1904 transit guide, along with many more historic maps of New York, can be found at the Martayan Lan Gallery, which is kicking of its  "New Amsterdam to Metropolis: Historic Maps of  New York City 1548-1964" exhibit on Nov. 9.
More this way
October 31, 2018

Waterfront Access Map makes it easier for New Yorkers to get to the shoreline

Fresh off the news that the city will invest over $250 million to connect and green 32 miles of Manhattan waterfront, it's become easier for New Yorkers to access the existing waterfront spaces open to the public. The Department of City Planning has just released the Waterfront Access Map, a tool to help you find one of the 200 open spaces situated along the city’s 520 miles of shoreline. It was released to mark the 25th anniversary of a 1993 zoning change that mandated public access to the city’s shoreline whenever a waterfront property is redeveloped.
Check out the map
October 10, 2018

Find out just how much sunlight any building in NYC gets

Natural light is at the top of the list when New Yorkers think about a building's livability. Recently at the Municipal Art Society Summit for New York City, Localize.city, an AI powered website that provides insights about every address in New York City, unveiled a shade analysis for every building in the five boroughs. The site's creators say the analysis gives NYC home hunters a way to really determine just how much light any given address gets.
More sunlight and shadows, this way
October 3, 2018

Mapping the growing pressure of residential displacement in NYC

While tenant displacement is happening in every New York City borough, the reason behind it differs from neighborhood to neighborhood. An updated, interactive map from the Association for Neighborhood & Housing Development (ANHD) looks at the loss of rent-regulated housing, property sales, construction permits, and evictions across the city's 763,000 residential properties as a way to determine the risk of residential displacement in every NYC community (h/t Curbed NY).
Explore the map
September 28, 2018

Where to find fall foliage in Central Park

You don't have to go upstate to experience the magic of fall foliage--right here in Central Park, there are 20,000 trees, many of which "transform into golden shades of yellow, orange, red, and more." Which is why the Central Park Conservancy has released its 2018 Fall Guide, complete with a map of the best spots to catch the autumnal bliss, as well as a list of upcoming fall tours.
READ MORE
September 19, 2018

Find one of those elusive electric Citi Bikes with this interactive map

Last month, Citi Bike rolled out 200 pedal-assist electric bikes in New York City. As one can imagine, demand is high for these e-bikes, which can reach speeds of 18 miles per hour and will most likely get riders to their destinations faster than the subway. A new map, aptly named "I Want to Ride an Electric Citi Bike," displays which docking stations have electric bikes at any given time (h/t Maps Mania). Users can find stations near them on the map, add them to a watch list, and be alerted within 10 seconds of its availability.
Get riding
August 24, 2018

Despite drop in average rent, Battery Park City is still the most expensive zip code in the U.S.

Despite a year-over-year decrease in its average rent, Battery Park City ranks as the most expensive zip code for renters in the United States, according to a RentCafe report. In 2017, the average rent in this downtown neighborhood was roughly $6,000/month. And while it experienced a nearly two percent decrease this year, with average rent falling to $5,657/month, Battery Park City is still the not-so-winning winner. Not surprising but still bleak, 26 out of the 50 zip codes with the most expensive average rents in the U.S. are located in Manhattan.
See the list
August 22, 2018

New tool maps every active construction project in NYC in real time

New York City's construction craze just got easier to track, thanks to a new tool that maps every major, active project across the five boroughs. The city's Department of Buildings released this week an interactive map and dashboard that provides real-time information on every active construction site in the city. According to the data, there are currently 7,437 active permits filed and nearly 198,000,00 total square feet of construction, as of Wednesday.
See just how construction crazy NYC is
August 20, 2018

Interactive map displays changes in New York City’s street grid over the last 90 years

The Department of City Planning (DCP) launched on Monday a digital tool that compiles more than 8,000 historic maps of New York City, dating back to 1924. The tool, called NYC Street Map, allows users to find the official mapped width and status of specific streets and how that relates to specific properties. According to DCP, NYC Street Map lets New Yorkers explore historic street and building images, find protected bike lanes and locate streets and public areas named in honor of 9/11 victims.
Explore the map
August 17, 2018

The real value of $100 in New York is just $86.51

A $100 in New York State has a real value of just $86.51, according to a report released this week by the Tax Foundation, an independent tax policy research group. And while New Yorkers know the cost of housing here ranks among the highest in the country and drives up the cost of living, everyday goods, including groceries, are also more expensive than most other states.
Not all that surprising
August 6, 2018

‘Bites of the Big Apple’ maps around-the-clock eating habits of New Yorkers

Not only are New Yorkers eating at all hours of the day, they're also posting photos of the grub on Instagram. An animated map from Crimson Hexagon dubbed "Bites of the Big Apple" displays all of the food-related posts on Instagram published over a 24-hour period across the five boroughs. Not surprisingly, the number of photos of fried chicken, burgers and pizza increased after midnight, with snapshots of salads most prevalent around lunch time. And proving NYC is the city that never sleeps, photos of coffee were popular at every hour.
Explore it here
Pitch a story icon Know of something cool happening in New York? Let us know:
July 30, 2018

This 1946 map shows how Native American trails became the streets of Brooklyn

While we take for granted the paths and roads we use on a daily basis, it's interesting to find out how they came to be. It's not a new concept that paths worn by the comings and goings of early dwellers and subsequent settlers in a particular area became roads, streets and thoroughfares, often with names that reflect their beginnings. Brooklyn Heights Blog (via Viewing NYC) shares some insight into Brooklyn's familiar roads that began as Native American trails on a 1946 map titled "Indian Villages, Paths, Ponds and Places in Kings County."
Peruse the map
July 25, 2018

New map from NYC Planning displays all zoning and land use applications dating back to 1970

The Department of City Planning launched a new data tool on Tuesday that displays the status of all zoning and land use applications dating back to 1970. The Zoning Application Portal, or ZAP, provides the public an easy way to search through 28,000 projects and pending applications, 500 of which are currently in public review. "This online tool is the ultimate in planning and zoning transparency," Marisa Lago, director of DCP, said. "It’s fast, it’s easy, it’s intuitive. We hope that New Yorkers – residents, advocacy groups, property and business owners – take full advantage, and get more involved in planning for our city’s future."
Explore the Zap Map
July 13, 2018

Beyond Manhattanhenge: Find mini-henges happening every day across NYC

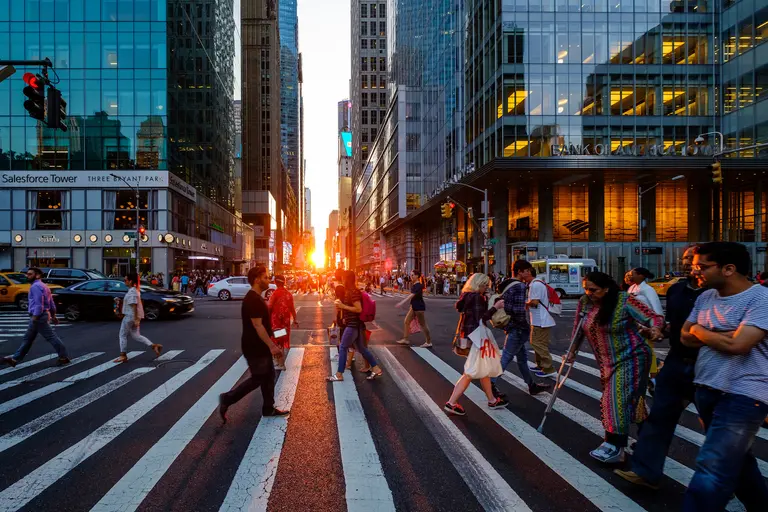
While the biannual sunset that aligns perfectly between two skyscrapers in Manhattan is perhaps the best known 'henge,' it's certainly not the only one. Because every neighborhood in New York City features its own pattern of a street grid, each has its own henge days (h/t NY Times). An interactive map called NYCHenge displays where mini-henges happen for every sunset throughout the year, allowing outer-borough residents to snap a solid sunset picture nearly every day.
Find a henge near you
July 10, 2018

MAP: See city owners vs. renters, block by block

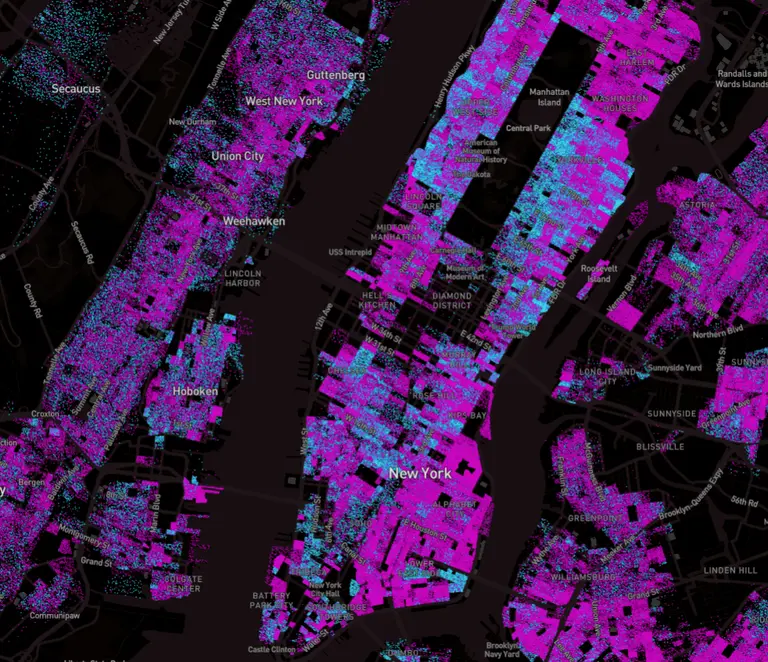
New York has been called a city of renters and with good reason. The real estate rent vs. own breakdown here is far different than that of other parts of the country, for a multitude of complex reasons. But it's also interesting to take a look at neighborhoods within the city. Ryan McCullough of Mapbox and Tippecanoe, the map geeks responsible for whizzing up this view of the U.S.A., was motivated to dig deeply into this particular data. The result was Owners vs. Renters, an interactive dot map showing every single homeowner and renter in the United States. You can zoom in on a major city hub and to see where more residents tend to be homeowners and where more people rent.
Find out more
June 26, 2018

MAP: Where to watch the 2018 Macy’s July 4th fireworks

The patriotic party-planners behind the Macy's Fourth of July live fireworks extravaganza happening next Wednesday evening have made sure to provide their usual thorough and handy guide suggesting prime spots for experiencing the world-famous pyrotechnics show. Get the 411 on official viewing points and use the interactive neighborhood finder to make sure you're well-situated when things go boom.
Get all the info, this way
May 29, 2018

Widespread oversight in thousands of NYC water tanks poses health risks, according to report

Photo via Ted McGrath on Flickr Thousands of wooden water tanks in New York City have not been properly inspected and cleaned for years, according to an investigation by City & State. And while the water towers have been an iconic part of the city skyline for over a century, the structures make it easy for pathogens and even dead animals to congregate and infiltrate the city's drinking water. According to the report, most building owners do not inspect and clean water tanks on a regular basis, despite newly updated health codes that require annual filings. City & State mapped more than 13,000 water tank inspection reports from the Department of Health and Mental Hygiene (DOHMH), letting the public know for the first time if and when a building's tank has been inspected and whether bacteria was found. Last year, just over 3,520 buildings with water tanks filed proof of inspection.
Has your building's water tank been inspected?
May 29, 2018

Metro Region Explorer map gives you the facts on any spot in the Tri-State area

As a beta project created by the NYC Department of City Planning, Metro Region Explorer enables you to explore population, housing, and employment trends within the Tri-State New York City Metropolitan Region. The map was developed as part of an ongoing commitment to providing better public access and as a way to better understand information about planning issues that affect the city as well as the region, as many planning challenges are interconnected with the realities of the larger area surrounding the city's core.
Explore the region

Our Mission

More than just current events, here you'll learn about the places, people, and ideas that are shaping your city.