Detailed Chart Shows the World’s Tallest Building Constructed Every Year

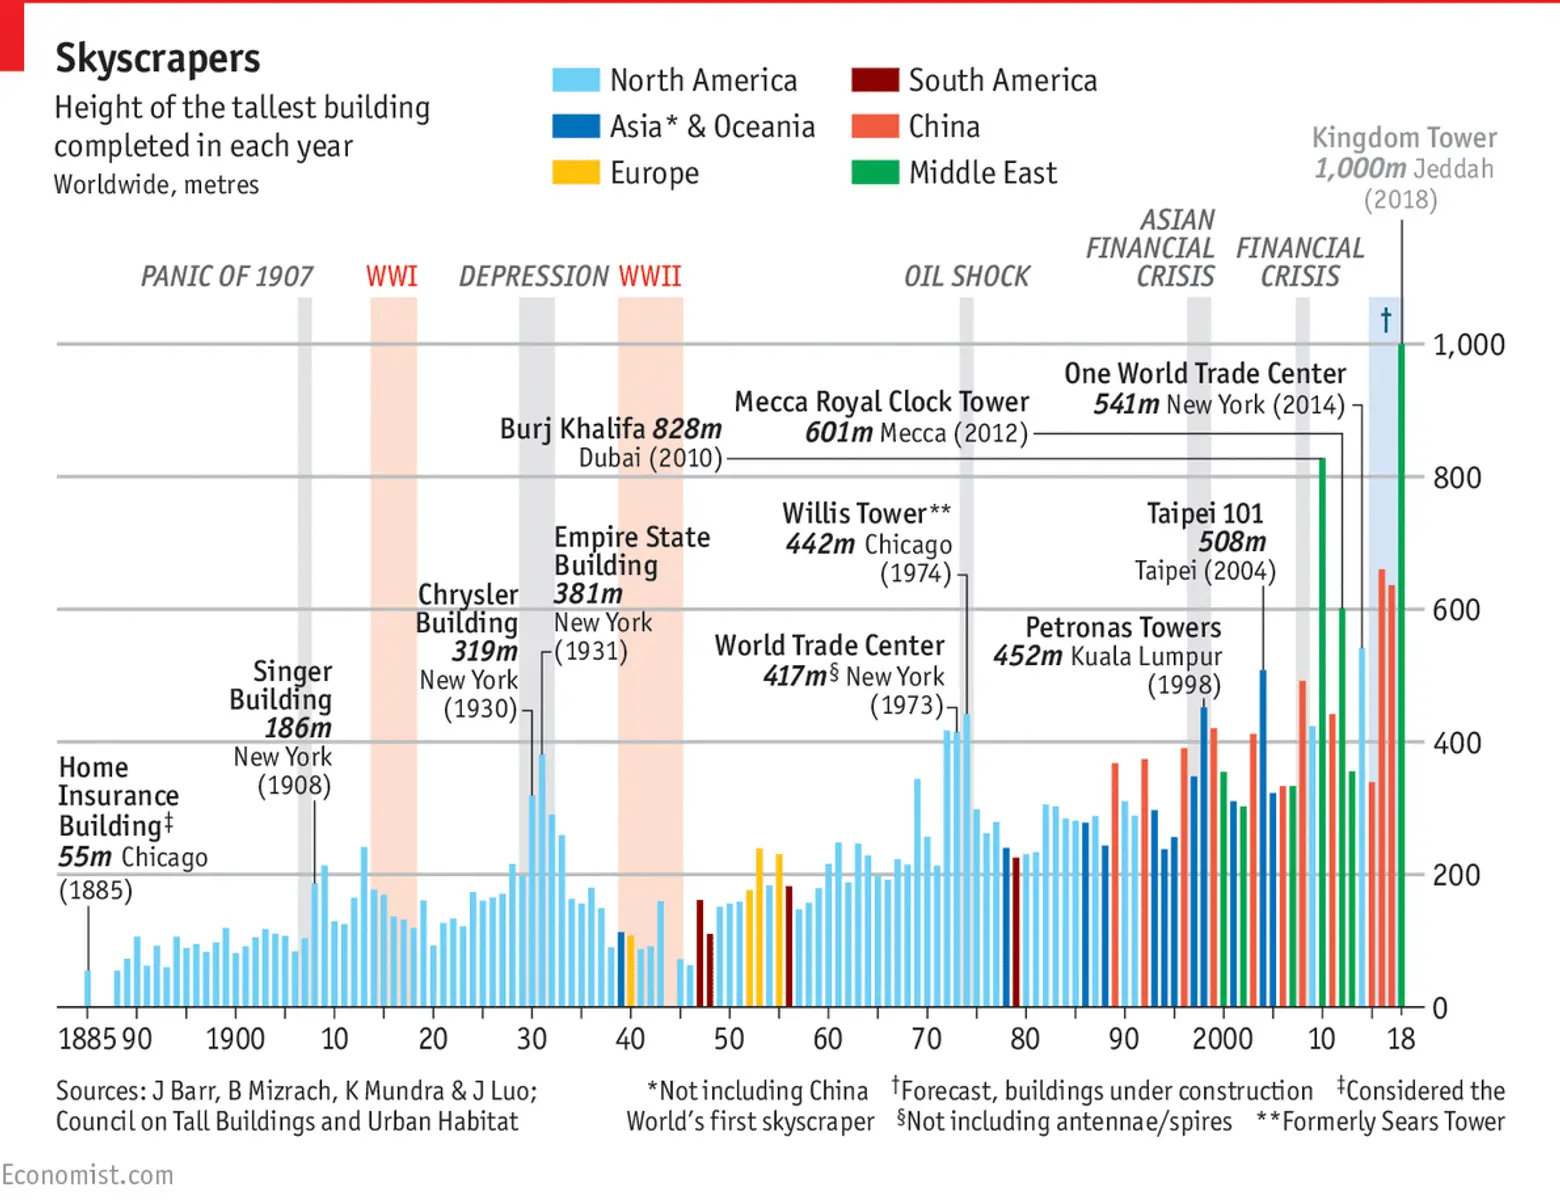
An infographic about the world’s tallest buildings is not a new idea (in fact, we’ve featured a great one, as well an interactive version, here before). But the Economist’s idea of looking at the race to the top connected with the times and world events is a fresh take. The highly detailed chart shows the tallest building constructed every year beginning in 1885. Each bar represents its height, and the color shows on what continent it was built. The chart also highlights exceptionally noteworthy buildings and certain world events that contributed to the ebb and flow of skyscraper construction over time.
Here are some interesting points that we can see on the chart:
- Between 1885 and 1990, the tallest buildings were almost always constructed in North America, mainly in the United States.
- During the Depression and the Oil Shock, tower heights peaked in North America.
- Following WWII, Europe and South America–in countries like Russia and Brazil–took the top spots.
- Beginning in the 1990s, China and other Asian countries such as Malaysia and Taiwan have been leading the skyscraper race; beginning in 2000, the Middle East started giving them a run for their money.
- In the most recent years, the Middle East has built the tallest towers by far.
[Via The Economist]
RELATED:


