Interactive map shows when and where to find fall foliage at its peak

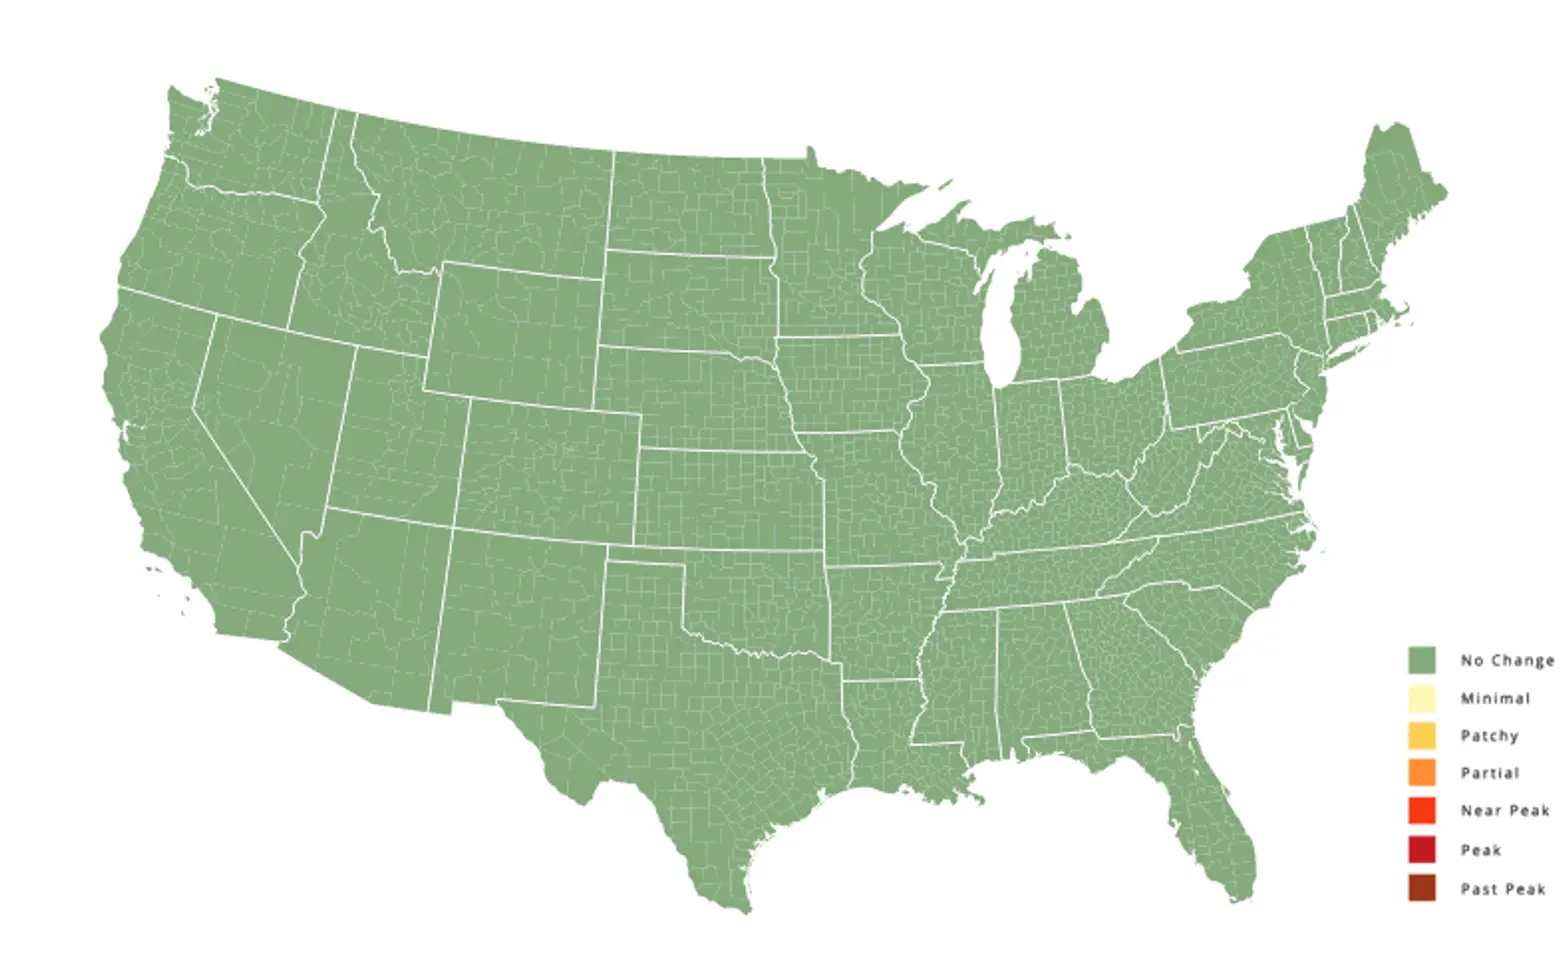
If you want to know when and where you can experience autumn in all its glory, look no further than this incredible map from SmokyMountains.com. The predictive map is the ingenious creation of Wes Melton, an engineer who developed a complex algorithm that can compute several million data points—ranging from historical temperatures to historical precipitation and forecast temperatures—to forecast exactly when fall will reach its fiery perfection in any given county across the United States.
Pull the slider to see the results ↑
“While scientists know exactly why leaves change colors, it is much more difficult to determine the precise moment when leaves will change colors,” says Melton. “There are multiple weather factors that must be carefully analyzed including temperature, sunlight, precipitation, and soil moisture.”
Melton’s map sources data from the National Oceanic and Atmospheric Administration and aggregated information from various government and private party data sources available online. The information is then manually tweaked based on his team’s knowledge of the subject.
“In the past, leaf-peepers would rely on historical leaf trends rather than using a data-based prediction method,” Melton shared. “Unfortunately, due to the drastic changes in temperature and moisture each year, this method was highly inaccurate. However, the millions of data points we analyze help us display an accurate, intuitive, and interactive map for the end user… Our end goal is to produce a map that’s useful, fun, and accurate.”
All images courtesy of SmokyMountains.com
RELATED:


