Interactive map reveals how your daily commute time compares with the nation’s worst
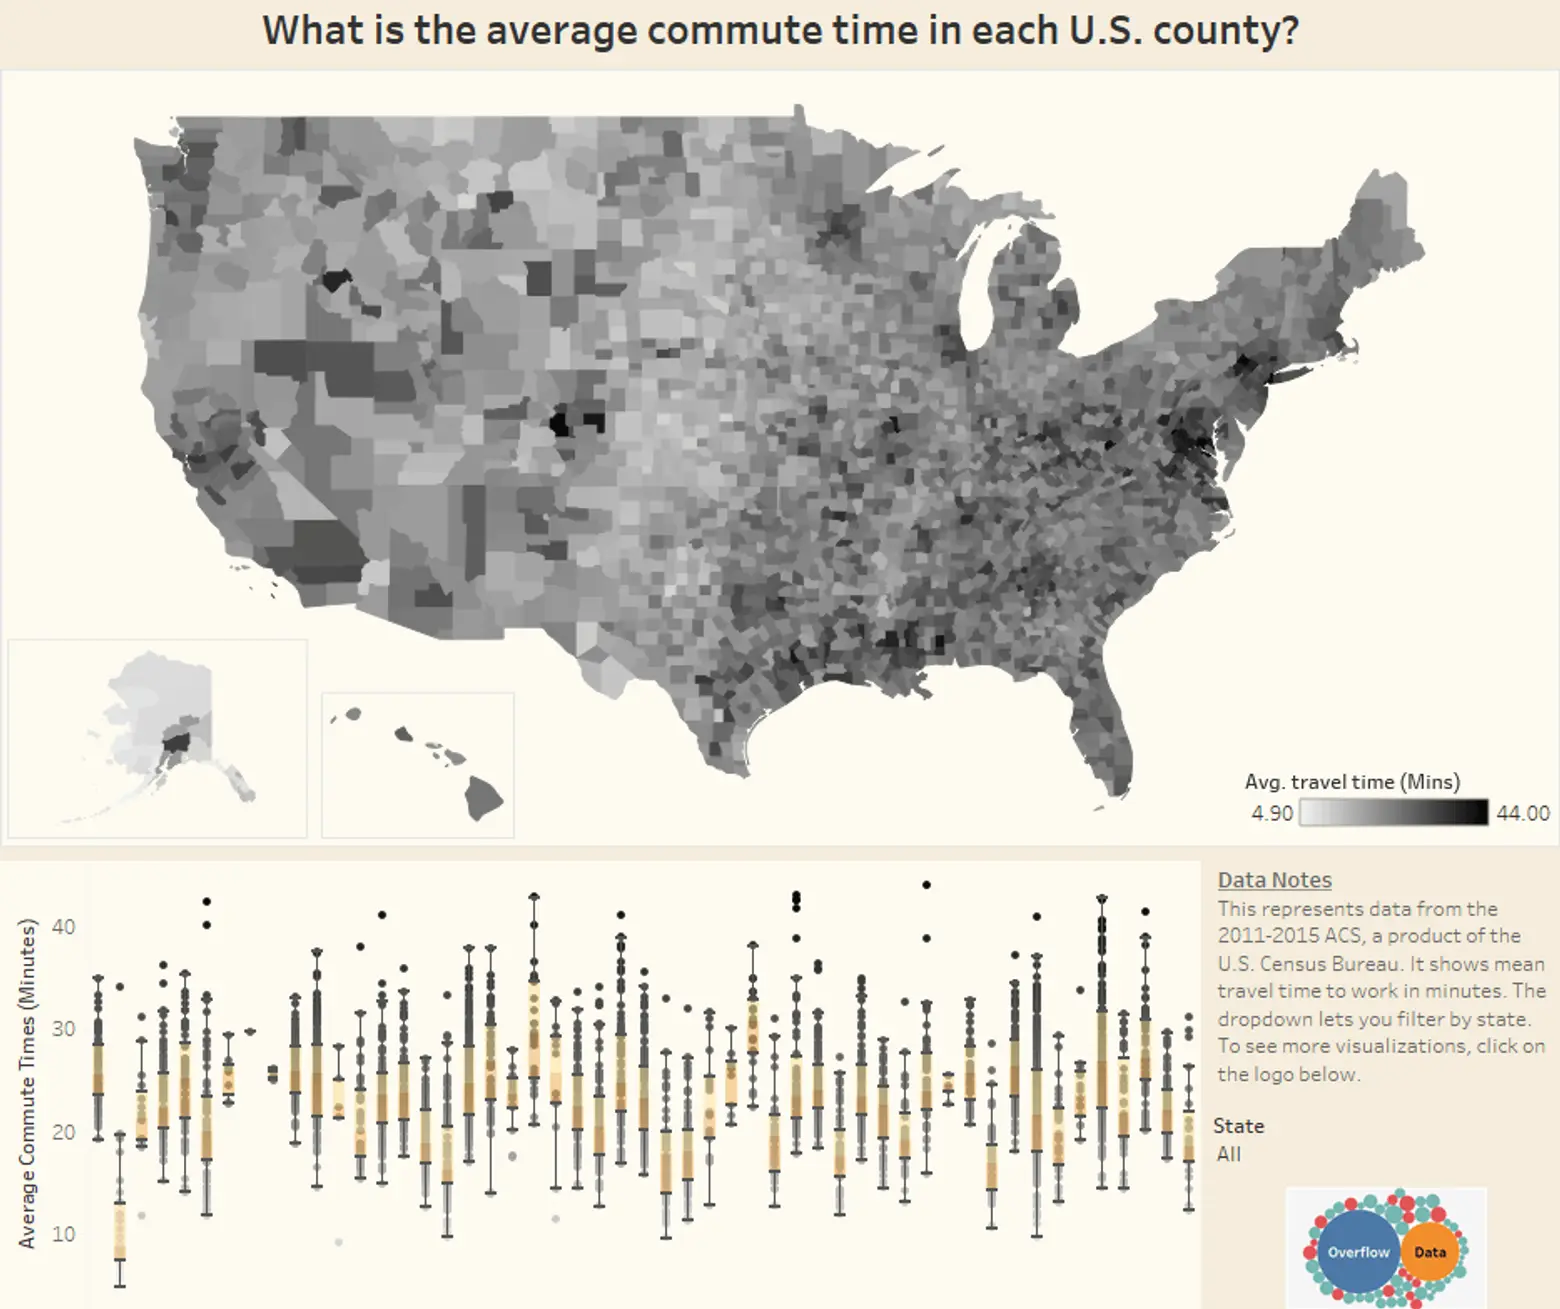
For something to ponder while trapped in subway hell or highway gridlock, a detailed visualization by statistician Chase Sawyer shows typical commute times clocked in every U.S. county, based on census data from 2011-2015. Citylab reports on the findings revealed therein; for example, we probably could guess that the top 10 easy-peasy commutes were in Alaska (where you can always find a seat on the subway), but you may not have guessed that Pike County, Pennsylvania has the worst transit time at an average of 44 minutes.
var divElement = document.getElementById(‘viz1499703339744’); var vizElement = divElement.getElementsByTagName(‘object’)[0]; if ( divElement.offsetWidth > 800 ) { vizElement.style.width=’780px’;vizElement.style.height=’711px’;} else if ( divElement.offsetWidth > 500 ) { vizElement.style.width=’780px’;vizElement.style.height=’711px’;} else { vizElement.style.width=’100%’;vizElement.style.height=’1136px’;} var scriptElement = document.createElement(‘script’); scriptElement.src = ‘https://public.tableau.com/javascripts/api/viz_v1.js’; vizElement.parentNode.insertBefore(scriptElement, vizElement);
That number one spot is probably attributable to proximity to New York City, but not enough of it: A small number of multi-hour journeys can easily skew the average. NYC itself, predictably, doesn’t get a break when you look at the nation’s counties. Four of the top 10 longest commute times belong to the New York counties of Bronx, Queens, Kings and Putnam, all averaging around 40 minutes each.
Predictably, the longest commute times were logged in areas just outside dense metropolitan areas. Other painful commutes are the norm in L.A. (duh) and the Bay Area. The mean times are just that (in more ways than one), obviously, and the actual humans doing the commuting will probably remember the longer hauls more.
A few big numbers in Colorado spots and Southern states like Mississippi and Louisiana were a surprise to Sawyer: “I didn’t expect commutes to be so long in some areas I thought were more rural,” he says, though it does make sense, he says, when you think about it: “The suburbs of densely populated and isolated areas had the longest commutes and other areas have shorter commutes.”
[Via Citylab]
RELATED:
- Animated map reveals how Manhattan’s working population moves from home to work over 24 hours
- Here’s what to expect as the ‘summer of hell’ for commuters begins
- Hudson River tunnel project’s price tag jumps nearly 50 percent to $13 billion
- The ‘map distance’ vs. the ‘geographic distance’ of the NYC subway

