Watch New York City grow from 1609 to today with this animated video assembled from historic maps

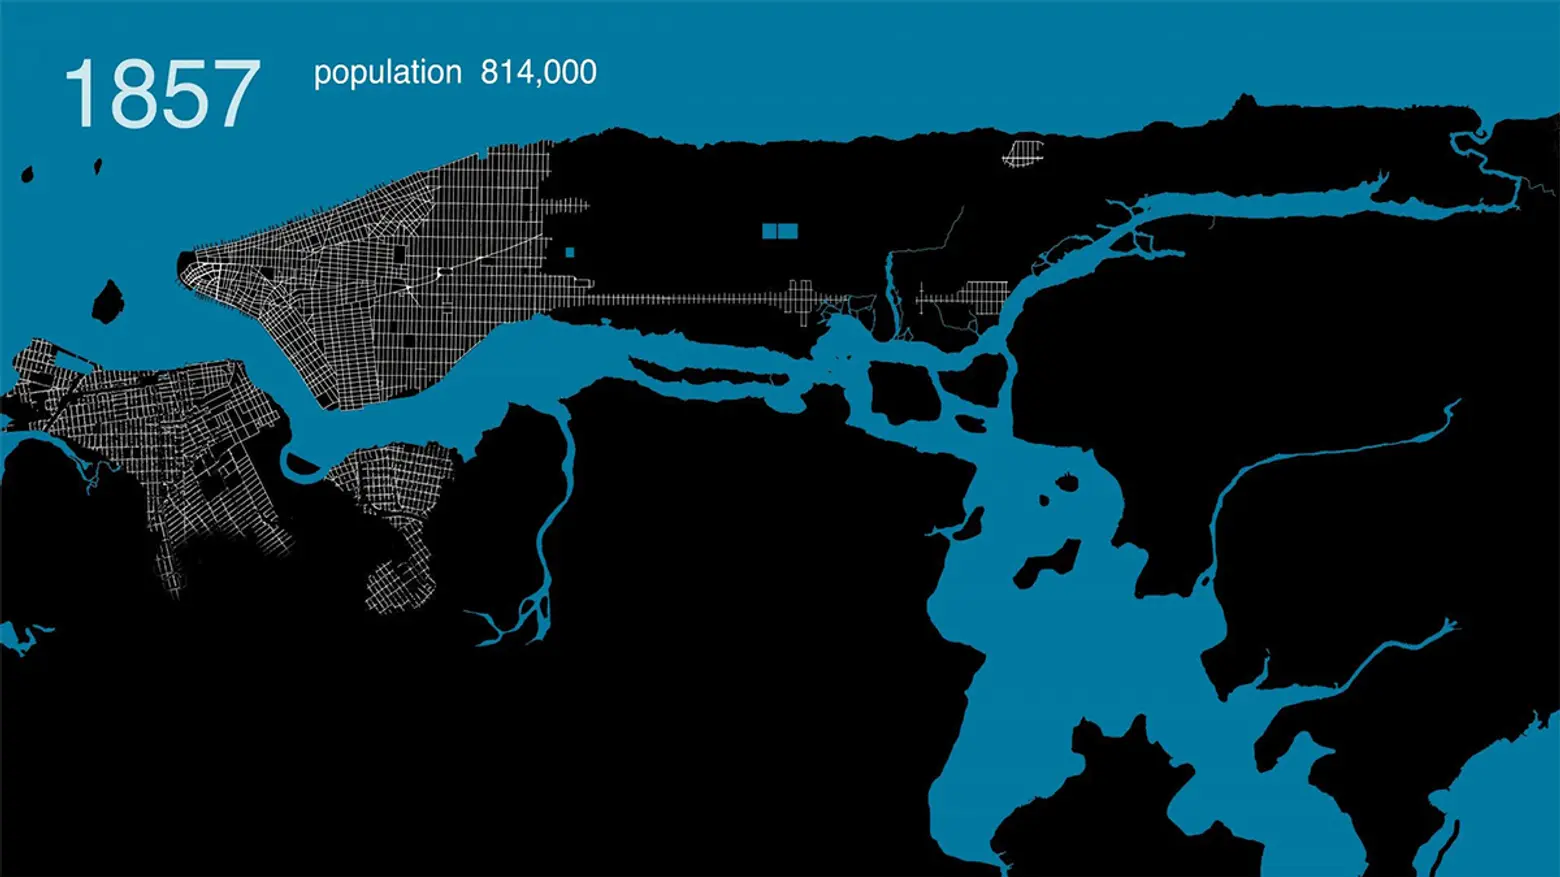
When it comes to the development of New York City over many, many years, we tend not to see the forest for the trees, so to speak. Here Grows New York, an animated map created by urban development buff Myles Zhang, gives us a seriously forest-eye view of how the city changes from the time the first native American tribes populated the five boroughs in 1609 to the noisy tangle of highways of 2019. Complete with cool facts and a soundtrack, the map visually animates the development of this city’s infrastructure and street grid using geo-referenced road network data, historic maps, and geological surveys, highlighting the kind of organic growth spurts that drive development over time, providing an “abstract representation of urbanism.”
The New York City Evolution Animation from Myles Zhang on Vimeo.
Zhang, an undergrad student in architectural and urban history at Columbia and Oxford University studies the causes of urban decay and its consequences on the built environment. With this animation, he uses computer simulations, website design, interactive mapping, and artwork to illustrate the forces that influence the way cities develop over time.
To create the short film, a hundred maps in the digital archives of the Library of Congress and New York Public Library were analyzed. About 25 were selected, downloaded, merged, stretched, and warped in a single document, a data visualization that informs our analysis of the history of the New York City grid to help answer the question: What can the built environment of Manhattan’s streets reflect about the evolving social and economic priorities of city planners and leaders?
6sqft went off the grid with Zhang to find out more about what motivates his research and curiosity.
Tell us a bit about your background. How did you get into architectural and urban history?
I often walk in the skyscraper canyons of Lower Manhattan. The jagged skyline of buildings of diverse height, age, and style are a reflection of this city’s constant changes. The lines of vertical windows drive my eye up. I wonder: What is the infrastructure needed to support these creations? And how do these buildings operate as machines for people in a larger, urban organism? With my background in art history, I’m concerned about using the visual language of drawing, website design, and animation to illustrate these urban complexities.
What are your plans for after graduation?
I’ve several projects in mind. For instance, I’m building an animated history of the New York water supply system, showing how the city is connected to a vast reservoir and watershed network the size of Rhode Island. I’m looking to do more animations to visualize different aspect of this city’s history. Next year, I’m attending graduate school for architecture and urban studies at Cambridge University.
What inspired you to create Here Grows New York?
E.B. White wrote a short essay in 1949 entitled Here Is New York. He praises the city for its diversity, people, soaring skyscrapers, urban walks, and hectic street life. His prose struck me, in particular the quote: “The city is like poetry: it compresses all life, all races, and breeds, into a small island and adds music and the accompaniment of internal engines.” E.B. White describes a city that may appear physically different but retains that same spirit of constant change. I wanted to express my own passion for the city through an animation that captures this change. While taking Professor Kenneth Jackson’s seminar on New York City history at Columbia, I received feedback on how to create the animation from Professor Gergely Baics at Barnard.
How long did it take you to put together?
The animation took me at least 1,000 hours to create over nine months of work. Most of the work involved stretching, warping, and aligning maps above each other to create a consistent scale before re-drawing them. Cross-referencing the existence of individual streets – to avoid historical errors or the anachronism of showing a modern street in an earlier year – took several hundred hours too. The final nine-minute video you see went through at least five drafts and two complete re-workings of the graphics.
Did anything surprise you in your research?
I’m surprised at the fluctuating rate of population growth and urban sprawl. For the first 150 years of its history, New York’s “urban” area did not grow much beyond a few dense streets in Lower Manhattan. And, then suddenly, in the late 19th century the rate of growth accelerated. I don’t think it is an exaggeration to say that New York grew more in a single decade of the 19th century than it did for its entire 17th century history.
You can find out more about Here Grows New York here.
RELATED:
- Explore 1980s NYC street by street with this interactive map
- 720,000 New York City tax photos from 1940 are now digitized so you can find your building online
- 1932 map illustrates a vibrant nightlife during the Harlem Renaissance
- NYPL’s ‘digital time travel’ maps let you compare today’s New York City with the past


